
Tropical Cyclone Products
DeepTCNet Product Description
1. Introduction
Tropical cyclone (TC) intensity and size are the principal attributes that largely determine TC-related potential deaths and economic damages. The DeepTCNet product offers quick, objective, and skillful estimations of TC intensity and size from satellites using deep learning. It is not intended to substitute for the official guidance from TC warning centers but to provide the community and forecasters with additional references. The DeepTCNet intensity data are provided beginning from storm formation to dissipation, and the size will be provided when the storm reaches a specific wind threshold.
2. How does DeepTCNet work
DeepTCNet is a deep convolutional neural network as a backend technique proposed to determine tropical cyclone intensity and size from geostationary satellite infrared imagery (Fig.1)
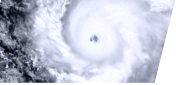
The required input of algorithms is infrared imagery (~11μm). All imageries are pre-processed to be centered on the TC location at the time of image from a Full Disk of geostationary satellites with 0.07 deg lat/lon grid; 156x156 pixels. In real time, the TC center position uses a short-term forecast track, interpolated to the time of the satellite image, from an applicable operational forecast center; given DeepTCNet tolerances less precise TC center locations. The outputs of algorithms are the resulting TC intensity and size. Overall, DeepTCNet models a relationship between the infrared imagery of TC and the intensity and size [i.e., Intensity/Size = f (IR)].
The original version of DeepTCNet described in Zhuo and Tan (2021) is developed with data of North Atlantic TCs. To generalize the method to the western North Pacific, transfer learning was applied. In particular, only the highest quality part of the JTWC best-track records was considered.
For further references please see Zhuo, J. Y., and Z. M. Tan, 2021: Physics-Augmented Deep Learning to Improve Tropical Cyclone Intensity and Size Estimation from Satellite Imagery. Monthly Weather Review, 149, 2097-2113. [https://journals.ametsoc.org/view/journals/mwre/149/7/MWR-D-20-0333.1.xml]

Fig. 1. The configuration of DeepTCNet.
3. About the product pages
The DeepTCNet-derived data for TC intensity and size include:
- maximum wind speed Vmax (in kt; 1 kt = 0.514 nm ),
- minimum sea-level pressure Pmin (in hPa),
- radial extent of wind speeds exceed threshold of 34 kt (17 m/s), 50 kt (25 m/s), and 64 kt in compass quadrants (northeast, southeast, southwest, and northwest) R34, R50 and R64 (in nm),
- radius of maximum wind RMW(in nm),
- derived product TC fullness (TCF; TCF=(R34-RMW)/R34).
Figures to visualize the above products, together with the track of TC center locations and infrared image, are presented on the product page for each TC case. The products archived as one-TC-one-file (in csv format; the variables with "CNN" in their name are the DeepTCNet products) also can be found from the product page. The following is an example of the product page for Typhoon In-fa (2021).
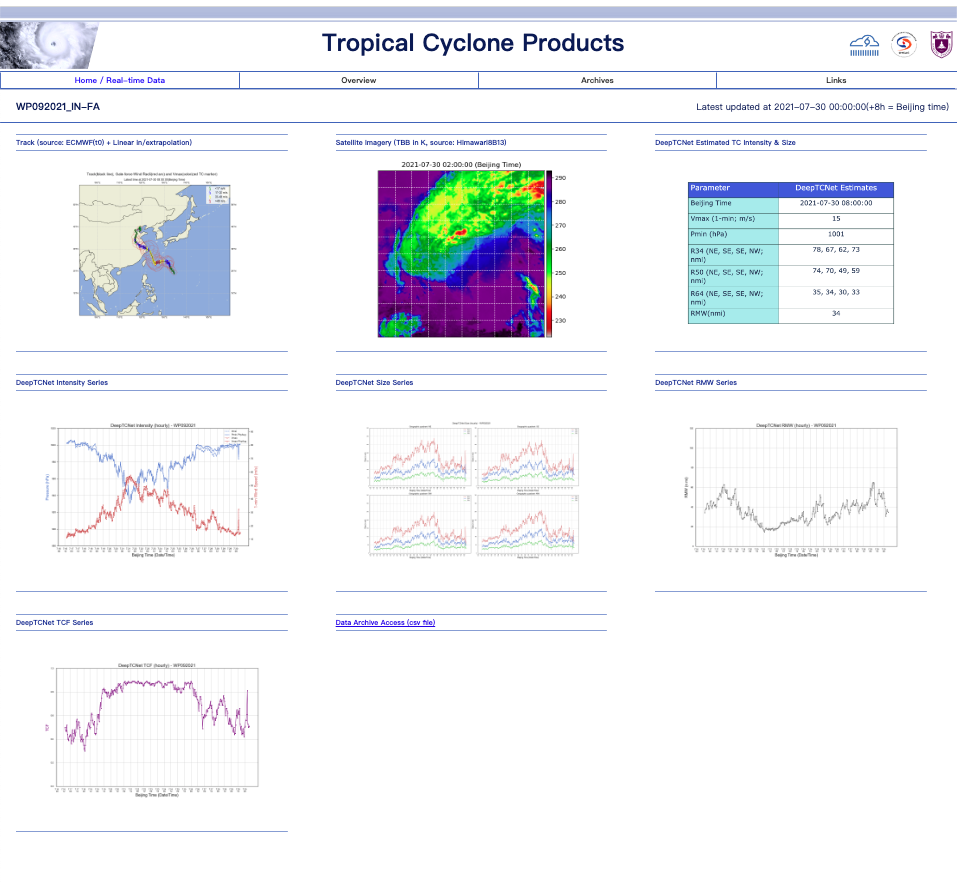
Fig. 2. DeepTCNet product page example.